Data visualization portfolio
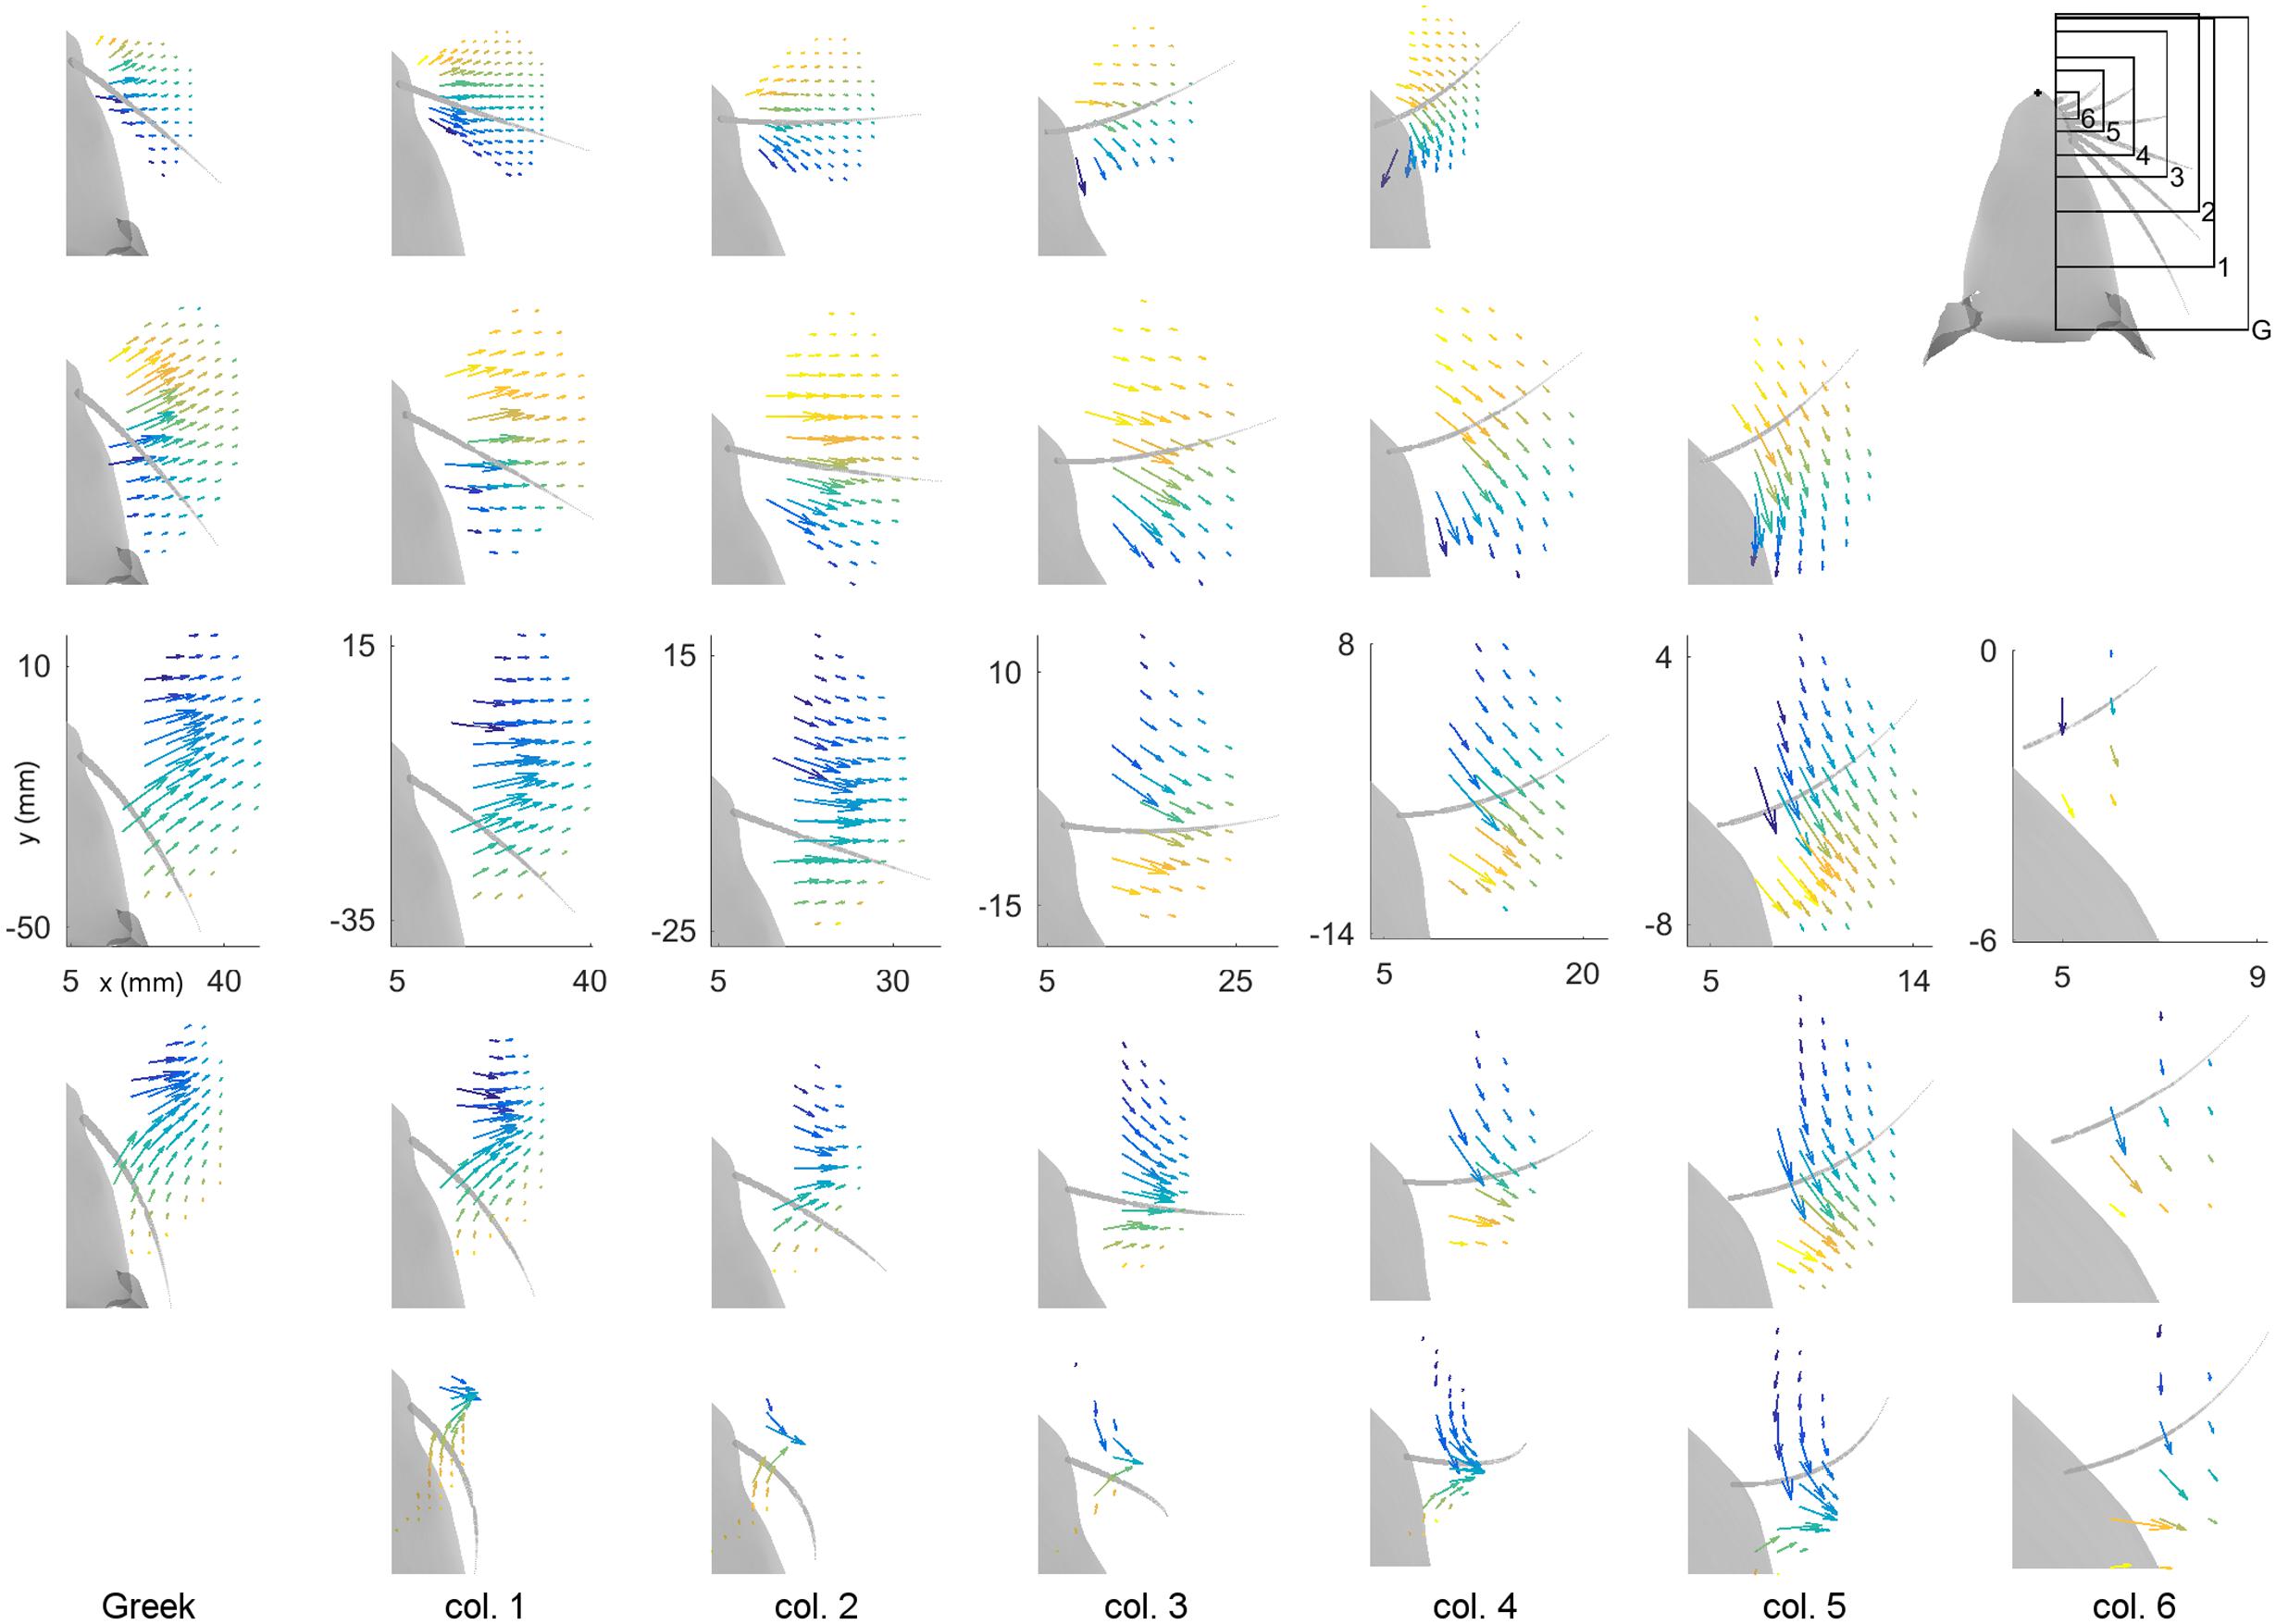
Magnitude and direction of bending associated with whisker-peg contacts
This figure visualizes the mechanical responses (bending moment) on a rat whisker when the whisker contacts various vertical pegs surrounding the rat. The ranges of pegs reached by each whisker are intuitively visible. It also provides intuition for the magnitude and direction each whisker undergoes when it reaches each peg.
Data
simulated by a 3D mechanical model of rat whiskers, based on beam theory.
Legend
gray curve: rat whiskers | arrow location: location of pegs reached by whisker | arrow direction: bending moment direction (rad) | arrow color and length: bending magnitude (N)
Copyright
© 2016 Yang and Hartmann
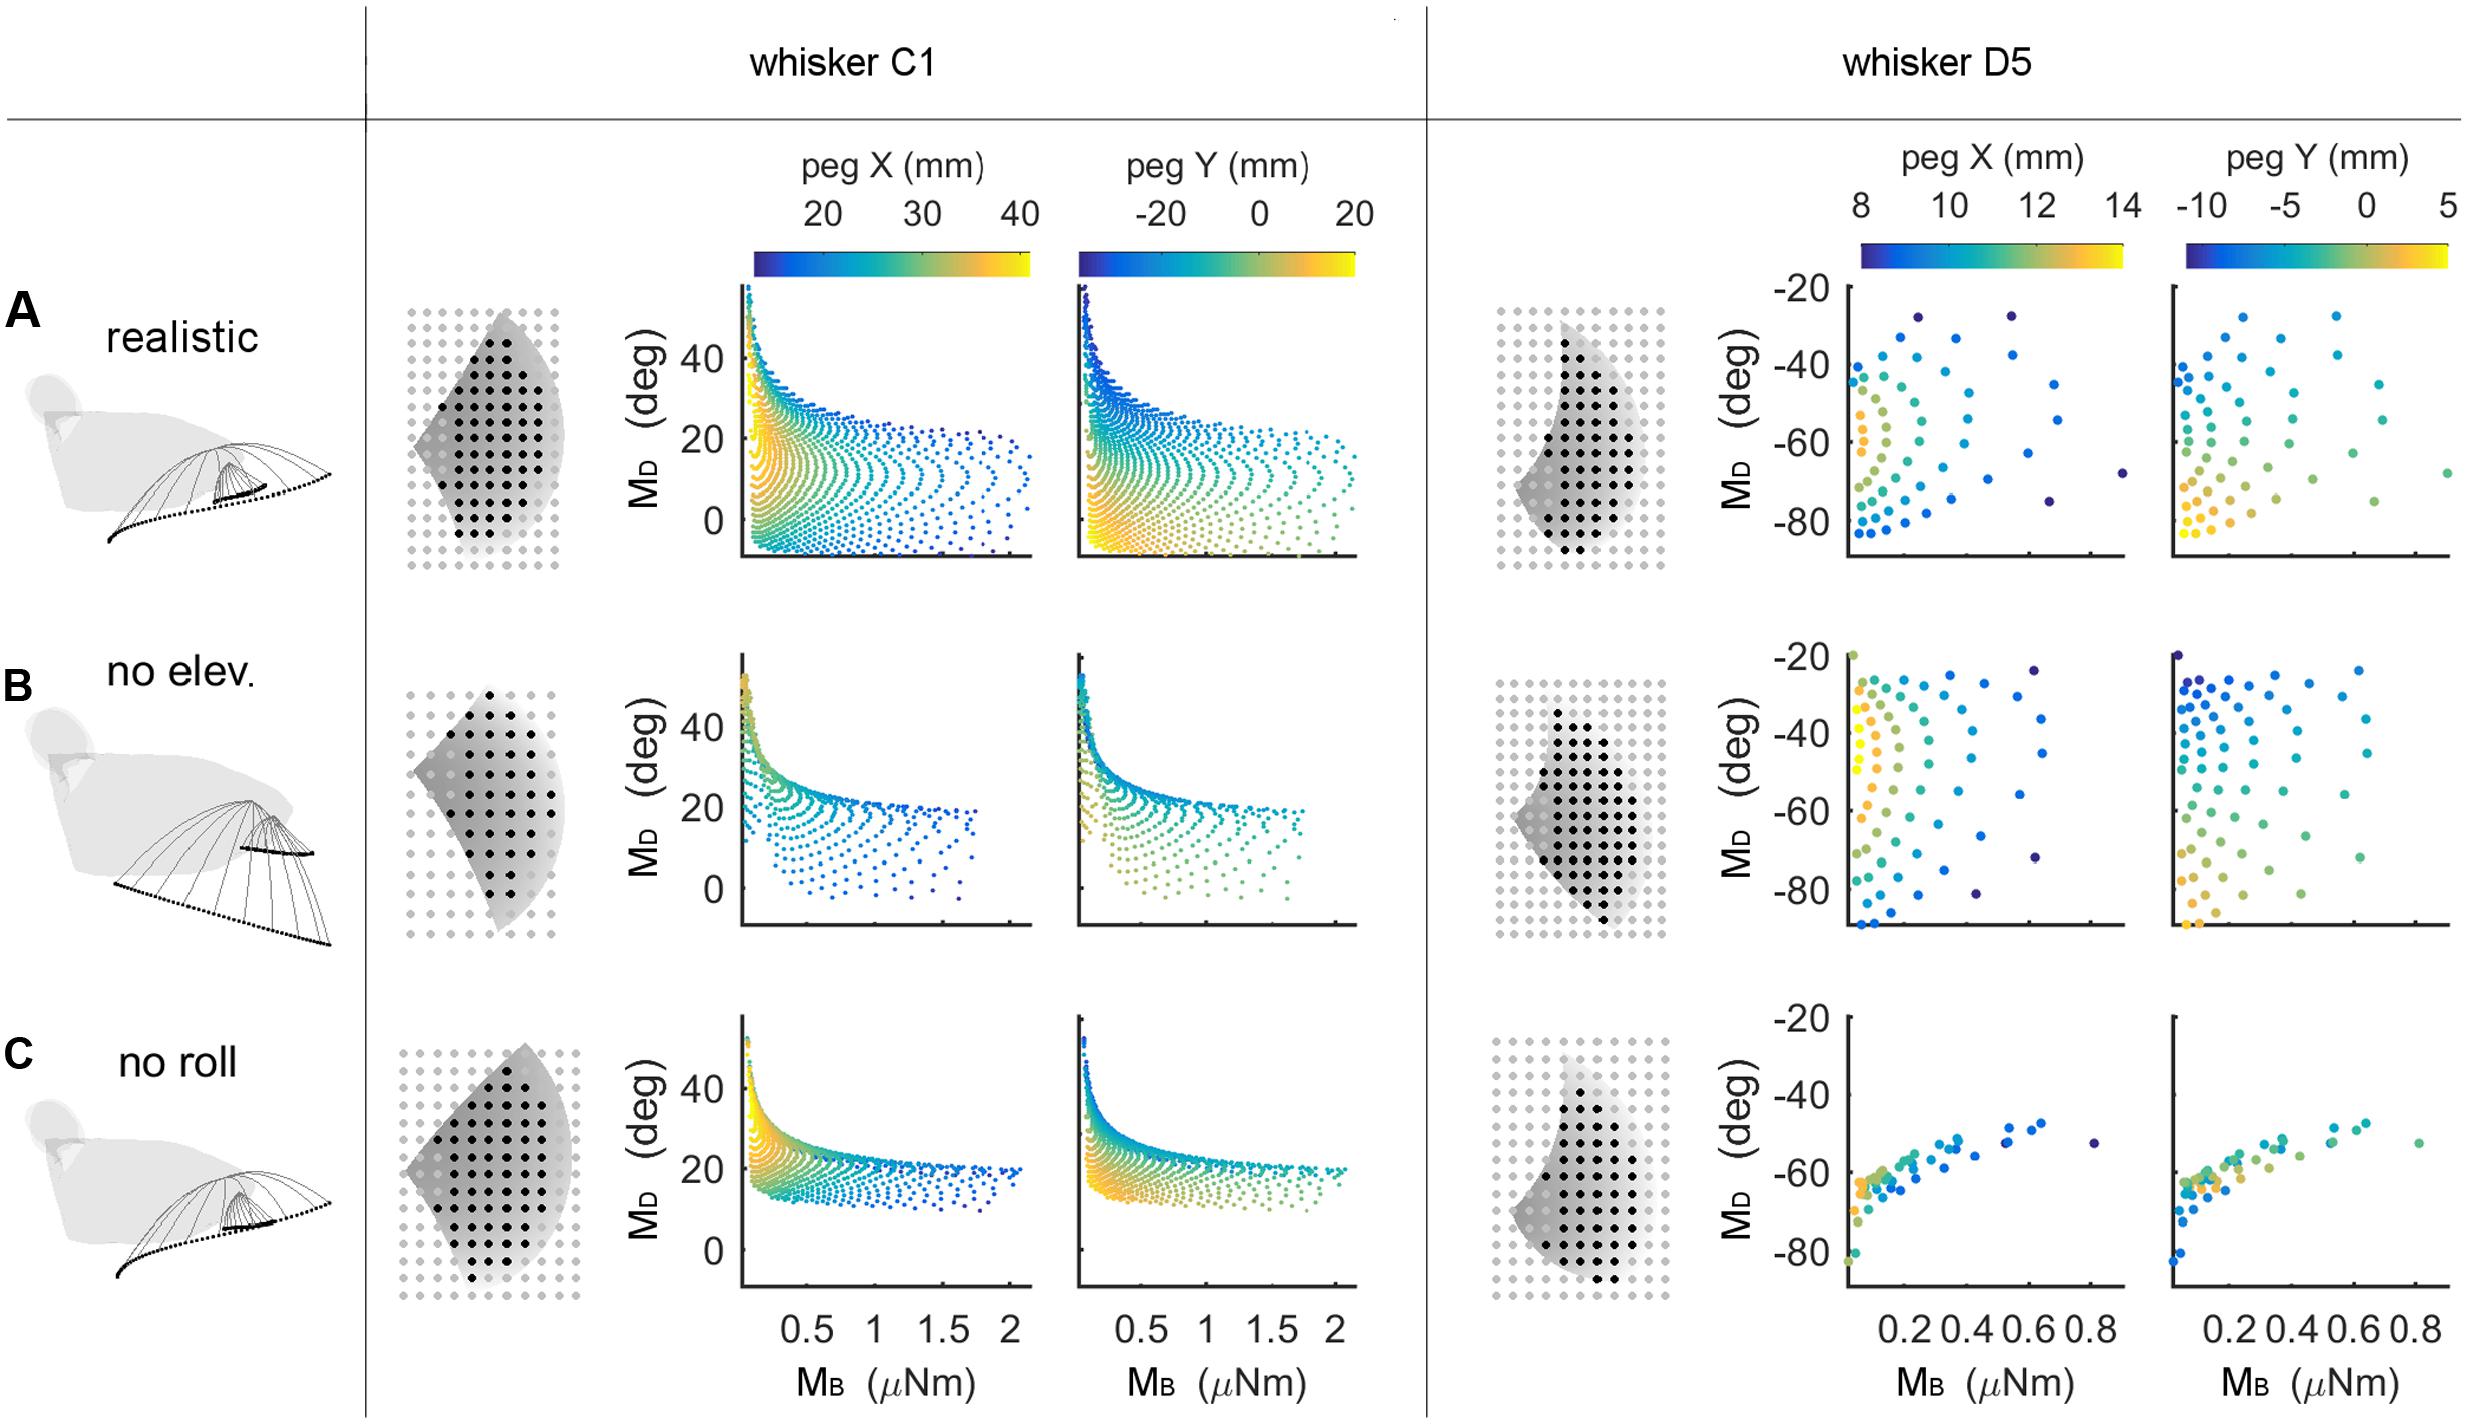
Moment-location mappings in different whisking conditions
This figure shows the location of pegs a whisker is able to reach, as well as how a rat may detect locations based on pairs of bending moment on its whiskers. It is obvious that the top row of dotted plots covers the largest spread of x-y values. The first panel also illustrates physically accurate trajectories of whisker movement.
Data
simulated by models of whisker kinematics and mechanics.
Legend
left panel: rat head, whisker and whisker tip trajectories during whisking | black dots: reached pegs | gray dots: missed pegs | gray surface area: area whisker sweeps over | gray area gradient: height| colors: peg X- and Y- locations | colored dots location: bending moment (X) and direction (Y)
Copyright
© 2016 Yang and Hartmann
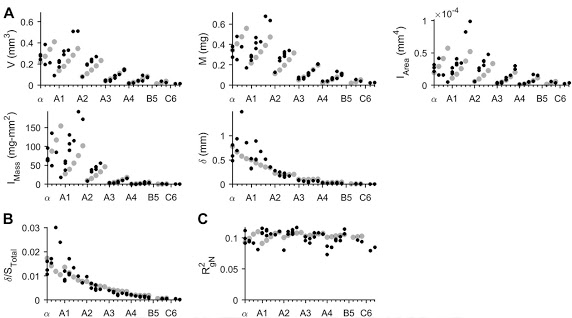
Rat whisker properties by whisker identity
This figure illustrates how the array of whiskers on each rat’s face (similar to human’s five fingers) vary in geometric and mechanical properties. It also includes comparisons of experimentally measured vs. statistically predicted properties. Various trends of y varying with x are observed (e.g. piece-wise increase, decrease, plateau).
Data
experimental measurement of plucked rat whiskers; theoretical calculation based on statistical trends of metadata.
Legend
black dots: experimentally measured properties | gray dots: calculated properties | x-axis: whisker identity (a total of 31)
Copyright
© 2019 the American Physiological Society